


System monitoring is an important part of daily administrative tasks. Following our recent webinars, showing the ways we can monitor our Open-E DSS V7, we decided to prepare a how-to instruction for you.
This article is outdated as the functionality has been improved. In order to get the updated information, go to the article: Monitoring Open-E DSS V7 and Open-E JovianDSS with Check_MK
We will show you how to configure the necessary tools, update your Open-E DSS V7 and finally, access and use the monitoring interface.
What is Nagios, OMD and check_mk?
Before we jump into a configuration process, you may need a quick introduction to the tools we will mention in this post.
Nagios is one of the most popular open-source monitoring software applications. It offers monitoring and alerting for servers, switches, applications and services.
OMD (Open Monitoring Distribution) bundles Nagios together with many important add-ons and can easily be installed on every major Linux distribution. Using it, we can avoid compiling and integrating Nagios add-ons manually.
Check_mk is a status GUI written in Python which supports user definable views and is able to display the status of several sites in one combined view. A very intuitive design and an easy operation are one of the strongest points of this tool.
The following instruction was made in Ubuntu. However, a similar configuration can be made in other Linux distributions.
Installing and configuring OMD
We start with the installation and configuration of OMD packages. Please follow the steps below:
- From root level*, update and upgrade your distribution’s package index using the following commands:
apt-get update
apt-get upgrade
In addition you can upgrade your distribution’s kernel:
apt-get dist-upgrade
*You may need to use “sudo su –” command, as Ubuntu do not login root by default.
- In order to install the OMD package, go to OMD website and navigate to Downloads section.
- Go to package repositories and choose the relevant version of the repository (in our case it will be “Ubuntu Precise 12.04”).
- Install the relevant GPG key in Ubuntu.
gpg --keyserver keys.gnupg.net --recv-keys F8C1CA08A57B9ED7
gpg --armor --export F8C1CA08A57B9ED7 | apt-key add -
- Next, we enable the stable release repository (in our case, it is the one dedicated to Ubuntu Precise 12.04):
echo 'deb http://labs.consol.de/OMD/ubuntu precise main'
>> /etc/apt/sources.list
- Following the installation, we run apt-get update to refresh our distribution repository:
apt-get update
- We then install the OMD:
apt-get install omd-0.56
Following the installation of OMD repository, we go to our Open-E DSS V7 server to perform an additional configuration and install a small update.
Applying the small update to Open-E DSS V7
To install the necessary update, we need to log in to our Open-E DSS V7 GUI and do the following:
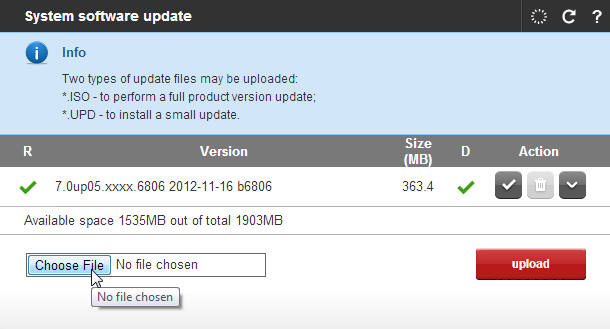
- From the Maintenance tab, select System update and navigate to System software update.
- Click Choose File to pick the small update upd_70139-DSS-V7.upd, then click on upload and apply.
 You will then need to manually restart the system.
 - Go to Maintenance tab, Shutdown, find System Restart and click on Restart button in order to reboot the server.
After the installation, the small update will be visible in the menu (it can be removed by clicking on the trash bin).

Enabling API in Open-E DSS V7
- Go to Setup tab and Administrator settings, then navigate to CLI/API Configuration.
- Tick the box to Use CLI/API, then specify port – 22223 and password.
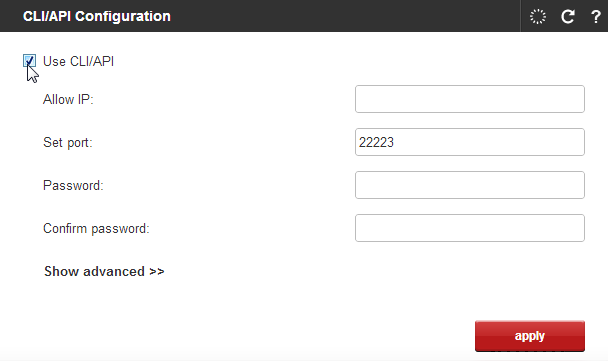
- In order to use the CLI/API functionality without password, you need to generate ssh key. You can do it by expanding show advanced menu and clicking on the generate and download button.

- Save the file in the relevant location (in this example, we will call it “dss60.key”).
To be able to use the ssh key in our Linux distribution, we may create a NAS share and then mount it in Ubuntu.Go to manual, to find out how to create a NAS volume and a NAS share in Open-E DSS V7. - After creating a NAS share, enable SMB with “Guest” access and NFS access (with default settings) for that share, so you will be able to use it under Ubuntu.
- Connect to the created share (via IP address of your storage server e.g. Run -> \\192.168.232.60) and copy the ssh key to the “Test” share.
- In Ubuntu, create directory /mnt/test:
mkdir /mnt/test
- Mount our Open-E DSS V7 share to that location:
mount –t nfs 192.168.232.60:/test /mnt/test
- Now, you can copy the file to the OMD folder (/opt/omd) – created during installation. You can use midnight commander to copy the file.
- The next step is the creation of a new site (ours will be called “dssmonitor”)
omd create dssmonitor
What you get is:
- • a site directory with preconfigured configuration files
- • a new user “dssmonitor” and a new group “dssmonitor” (identical with the name of your site). The new user is also a member of the group omd, which is created during installation.
- Then, we start the omd on our newly created site:
omd start
We are now ready to perform an additional configuration of OMD.
- We edit the file “/opt/omd/sites/dssmonitor/etc/check_mk/main.mk” (we can use mcedit command for that purpose):
mcedit /opt/omd/sites/dssmonitor/etc/check_mk/main.mk
- In the relevant space, we insert the host’s IP and type of the protocol used:
all_hosts = [‘192.168.232.60|ssh’]
- Next, we append the following entries, to define commands that will be used to connect to API (see convention below):
datasource_programs = [ (“ssh –p default port number – i
ssh key's location path –l username for API  + host IP + command
that will be run over API to DSS, [‘protocol used’] ,
in which section our monitoring statuses will be shown), ]
In our case, it will be:
datasource_programs = [ (“ssh –p 22223 –i /omd/dss60.key –l
api 192.168.232.60 check_mk_agent”, [‘ssh’], ALL_HOSTS ), ]
- Save changes to file.
- The important part is to ensure the correct ownership (our OMD user) and access permission (read and execute for owner only) of our ssh key.
- To change the owner of our ssh key file, we use the following command:
chown dssmonitor /omd/dss60.key
- To change access permission, so only the owner has read and execute rights, we use:
chmod 500 /cmd/dss.key
- Then, we log to OMD as dssmonitor using “su” command:
su dssmonitor
- To test the configuration, we can run “api” command:
ssh –p 22223 –i /omd/dss60.key –l api 192.168.232.60 check_mk_agent
When prompted to continue connecting type yes.
The output will be returned in the terminal, which will later be interpreted in check_mk tool. - We need to run two more commands:
First will do the following: retrieve data from our Open-E DSS V7, find all available services, and list them:check_mk -I
The second, will reload the OMD configuration and validate that it is working properly:
check_mk -O
Monitoring the Open-E DSS V7
- In order to check the status of our Open-E DSS V7 in OMD, go to your internet browser and navigate to the following address: your Ubuntu IP*/name of your site – in our case it will be:
192.168.232.58/dssmonitor
*you can check the IP of your Ubuntu using the ifconfig command
- When prompted for a username and password – the default credentials are:
Username: omdadmin
Password: omd
- We will then be able to choose one of the available GUIs. In our example we will go for “Check_MK Multisite”
- When in GUI, from available views, choose Hosts -> All hosts, and select the relevant host (see below).
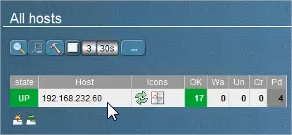
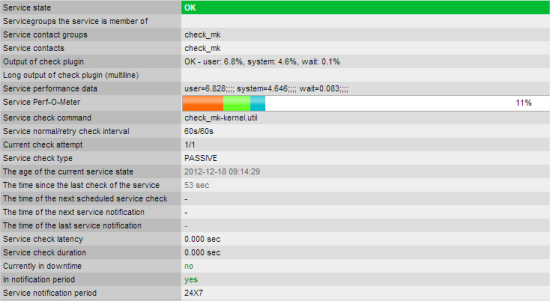
You will then see the statuses of all available services (that are being monitored by the tool):
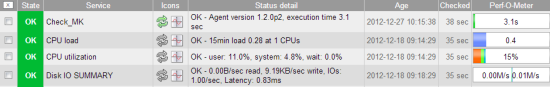
You will also have access to detailed statistics (including graphs) about each service:
The services that you can monitor with the tool include:
- CPU load
- CPU utilization
- Disk IO Summary
- NI information
- Memory utilization
- TCP connections
- Uptime
- NAS Volume space taken
- and many more…
Check out the videos below and watch our engineers performing the same configuration (English and German version).


7 Comments
Denny /
20, 03 2013 01:03:59hi,
I have already a fully install Icinga server and installed the small updated (check_mk_agent) plugin for DSS7, but the first test fails:
icinga@icinga:~/.ssh$ ssh -p 22223 -i id_dsa_iscihead-s -l api 192.168.1.100 check_mk_agent
CLI/API: method not found
So, what could be the problem?
cu denny
Denny /
20, 03 2013 01:36:34hi,
fixed it by myself. I missed the reboot 🙂
rajmundo /
10, 04 2013 08:34:19The link to SU is broken!!! Please correct it…
regards!
martin /
03, 07 2013 09:05:53Hi.
Thank you so much for adding nagios support – finally!!!
However there are two problems here, (installing small update and configuring nagios or icinga in this case is no problem), setup is a active-active cluster (of course both servers are identical), both problems on both servers.
1) check_mk reports a critical state for drbd:
“DRBD drbd8 status”
“CRIT – Connection State: WFConnection, Roles: Secondary/Unknown, Disk States: UpToDate/Outdated”
But in open-e dashboards all resources are “OK” (volumes, replication and so on, nor error logs).
So How do I see which ope-e volume is DRDB8? and how can I fix it? why does check_mk report a problem that is not visible in open-e webfrontend?
2) check_mk reports a “unknown” status for something:
“RAID Unit 0 Optimal”
“UNKNOWN – invalid output from agent, invalid check parameters or error in implementation of check dss_raid. Please set debug_log to a filename in main.mk for enabling exception logging.”
Logfile:
Invalid output from plugin or error in check:
Check_MK Version: 1.2.2p2
Date: 2013-03-07 10:49:37
Host: 10.0.0.12
Service: RAID Unit 0 Optimal
Check type: dss_raid
Item: ‘0 Optimal’
Parameters: None
Traceback (most recent call last):
File “/var/lib/check_mk/precompiled/10.0.0.12”, line 702, in do_all_checks_on_host
^A^N^A^R^B^F^A^F^A^F^A^C^A^U^A1^B^R^A^Q^B^L^B^R^A^Q^B^L^B^P^A^R^A^F^A^Q^A^R^A^F^A^Q^B^F^A^O^A
File “/var/lib/check_mk/precompiled/10.0.0.12”, line 1484, in check_dss_raid
IndexError: list index out of range
Agent info: [[‘LSI;0’, ‘0;Optimal’, ‘Drives#;2’],
[‘0;Optimal’, ‘Drives#;2’],
[‘0;Optimal’, ‘Drives#;15’]]
So what is going on here? Which RAID unit is this? The checks of the Logical Volumes of the RAID Controller ae somewhere else…
Thank you so far
Regards
Martin
Joey Hazlett /
12, 01 2016 05:30:18Is it possible to gather RAID information with raw SNMP? It looks like check_mk is a “comprehensive IT monitoring solution.” I already have my own IT monitoring solution in a custom configuration of Nagios that is monitoring the rest of my network. I just want to know immediately if one of my disks has failed without having to constantly log into the web GUI. If I can just figure out what OIDs I need to read to get this information from SNMP, I can use check_snmp to gather and report the information. Is this possible without completely changing my monitoring architecture?