Android users have already been provided with step-by-step instructions on how to install aNag, an Android application for Nagios – now it’s time for iOS users.
As you may already know, applications for Nagios allow you to control your system status wherever you are. Learn how to install, connect and use MobiosPush, an application for Nagios that enables an easy monitoring of your Open-E software on you iOS device.
First, you should have your Nagios system already configured and running. The system should be accessible on your device. Find more information in the official Nagios doumentation.
Installation of the Nagios client application
Install the MobiosPush application on your Apple device.
Note: the description below might be out of date since the application is no longer available in the AppStore.
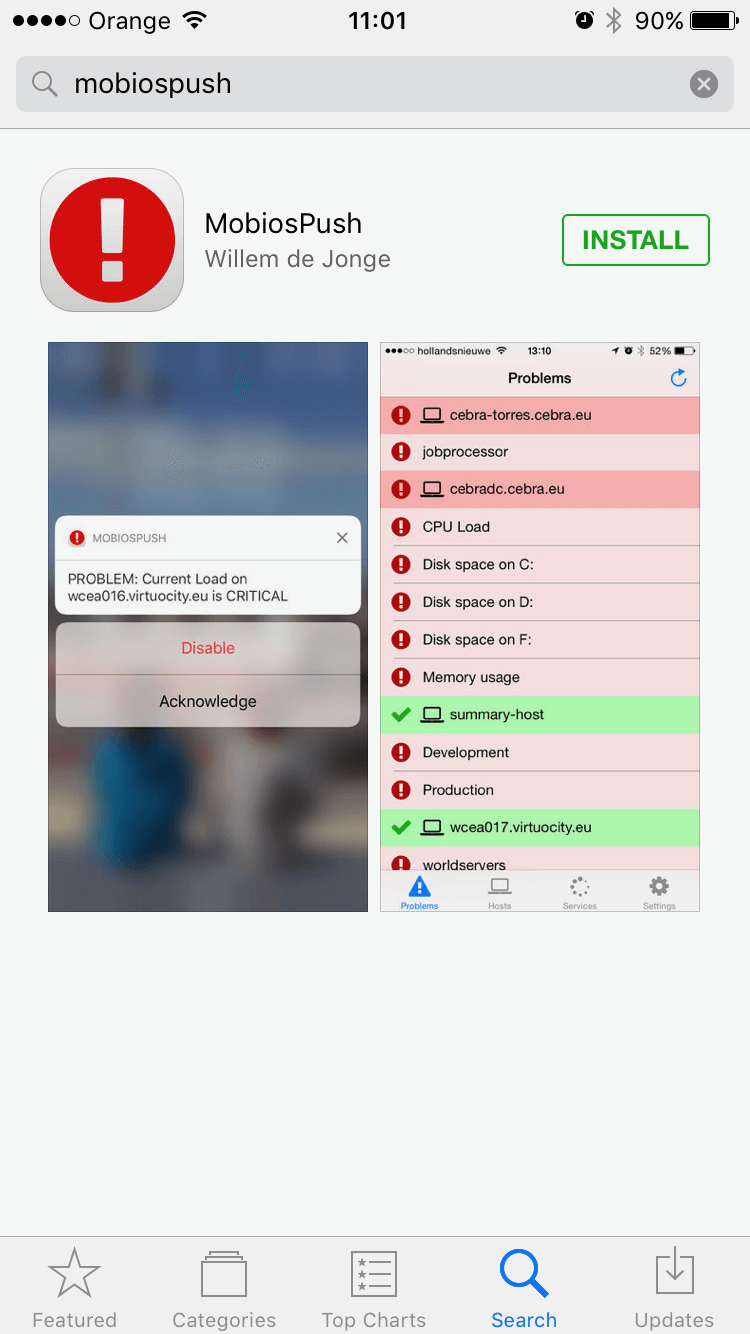
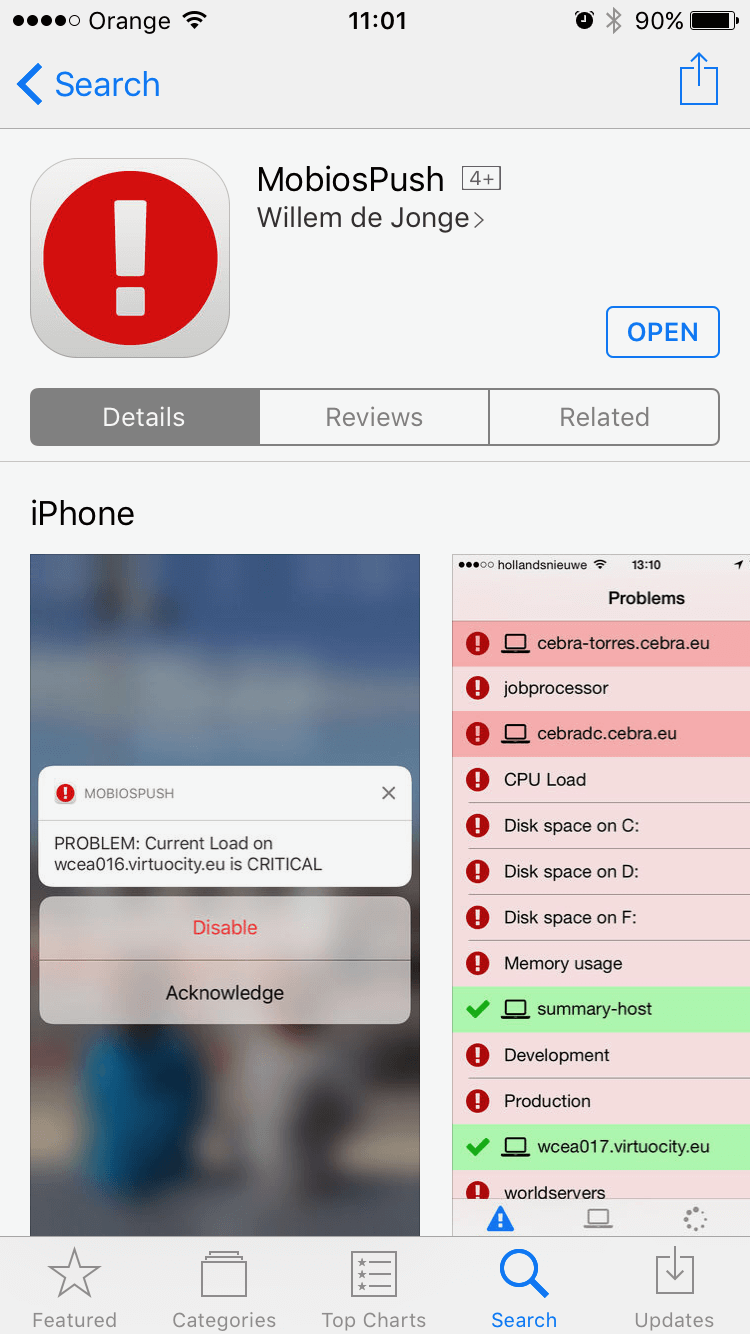
1. Go to the AppStore and find the “MobiosPush” application. There is also a possibility to proceed with a remote installation by visiting the web AppStore.
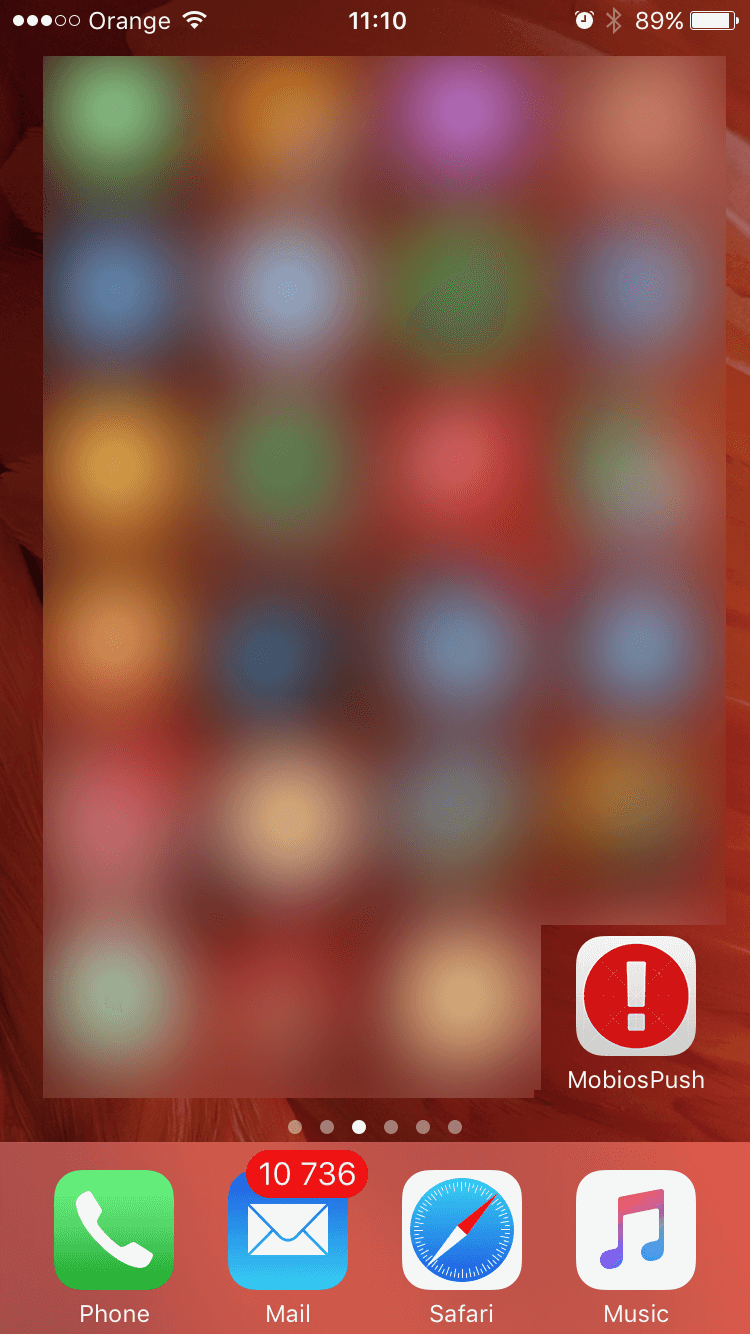
2. Click “INSTALL” to install the application. Next, click “ACCEPT“. After the application is installed on your smartphone, click “OPEN“. A relevant icon will appear on your applications list.
Connecting to the Nagios system
Establish a connection to the Nagios system and receive status information.
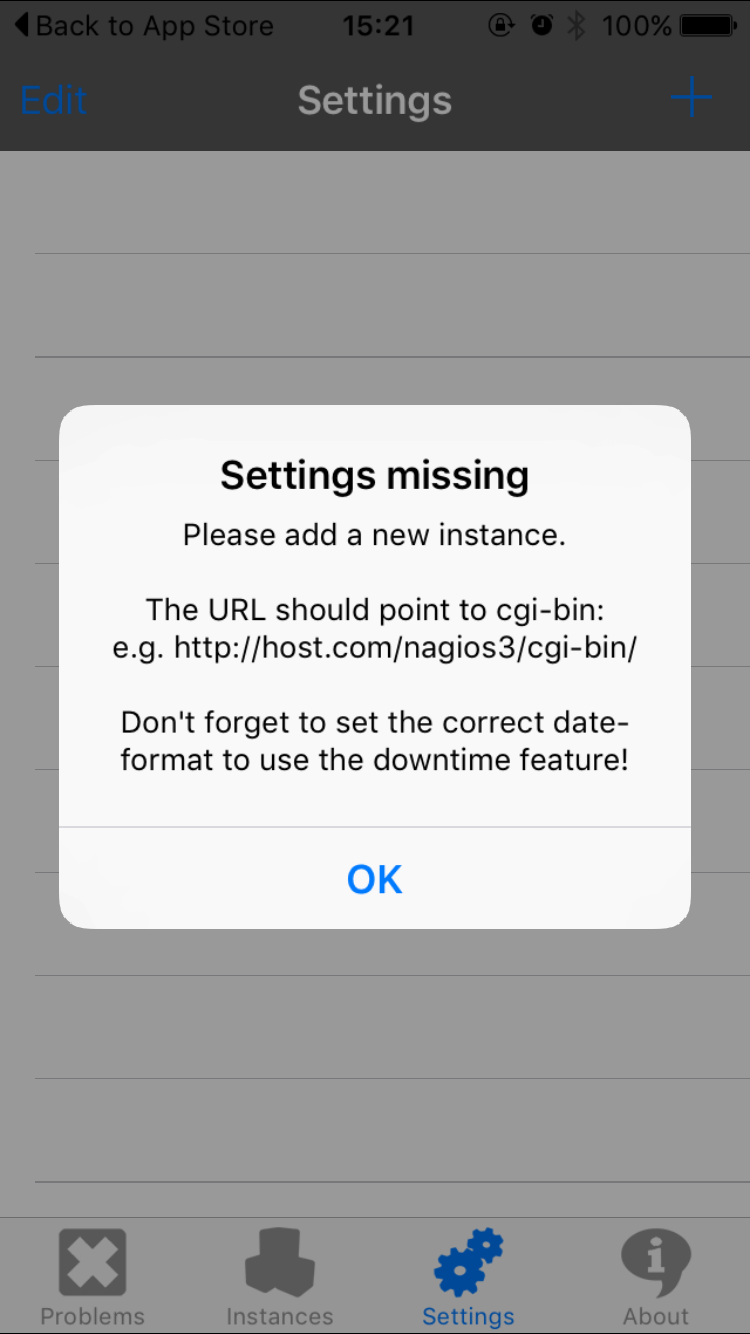
1. After you open the application for the first time you will see a notification “Settings missing” – this means that no connected Nagios servers were found. After confirming the message, the application will take you to the server configuration screen.
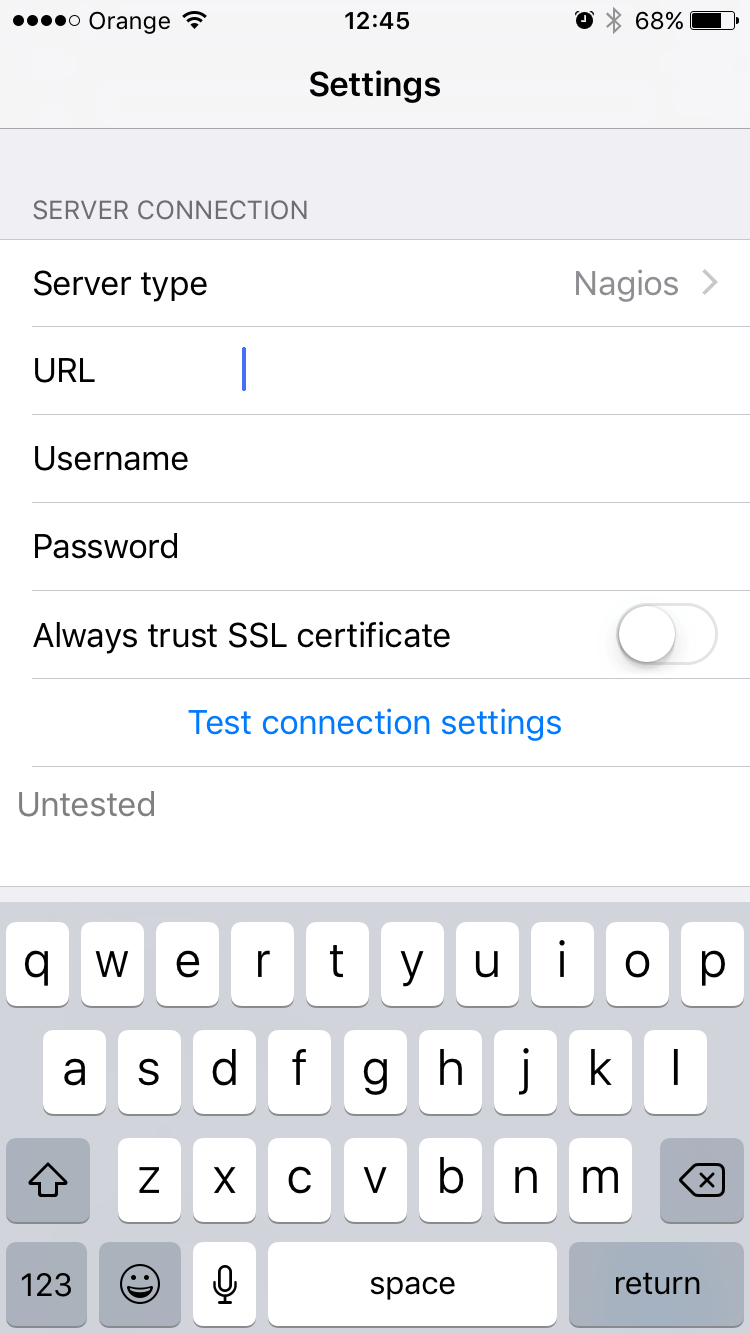
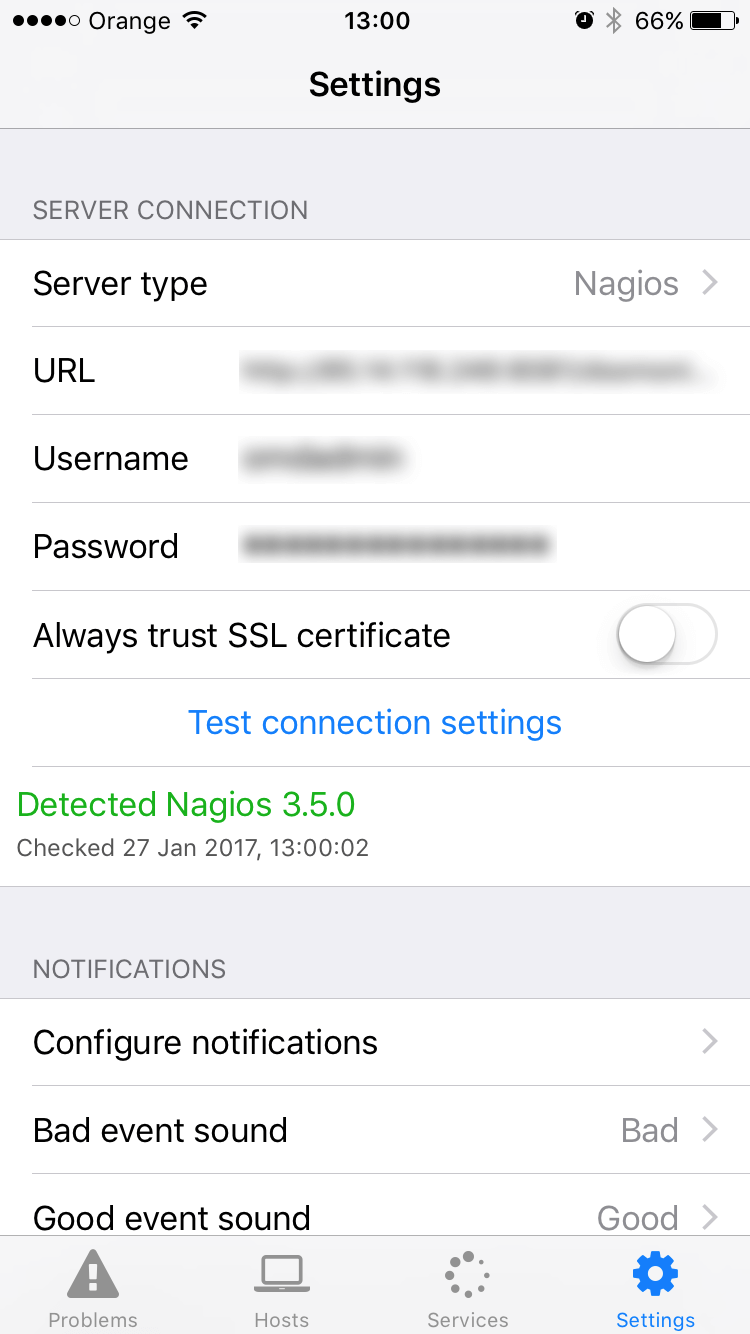
2. The SETTINGS screen provides all the details of your running Nagios instance:
- Instance name – name under which it will appear in your MobiosPush application
- CGI Directory URL – an URL directing to your Nagios CGI folder (usually named “‘cgi-bin folder”)
- Username – admin login
- Password – admin password
There are several other settings also available for an advanced and fine-tuned installation.
NOTE: Remember to finish the URL address with a slash “/” sign, as the URL should direct to the CGI folder (usually named “‘cgi-bin folder”), not a single file.
Basic usage of MobiosPush
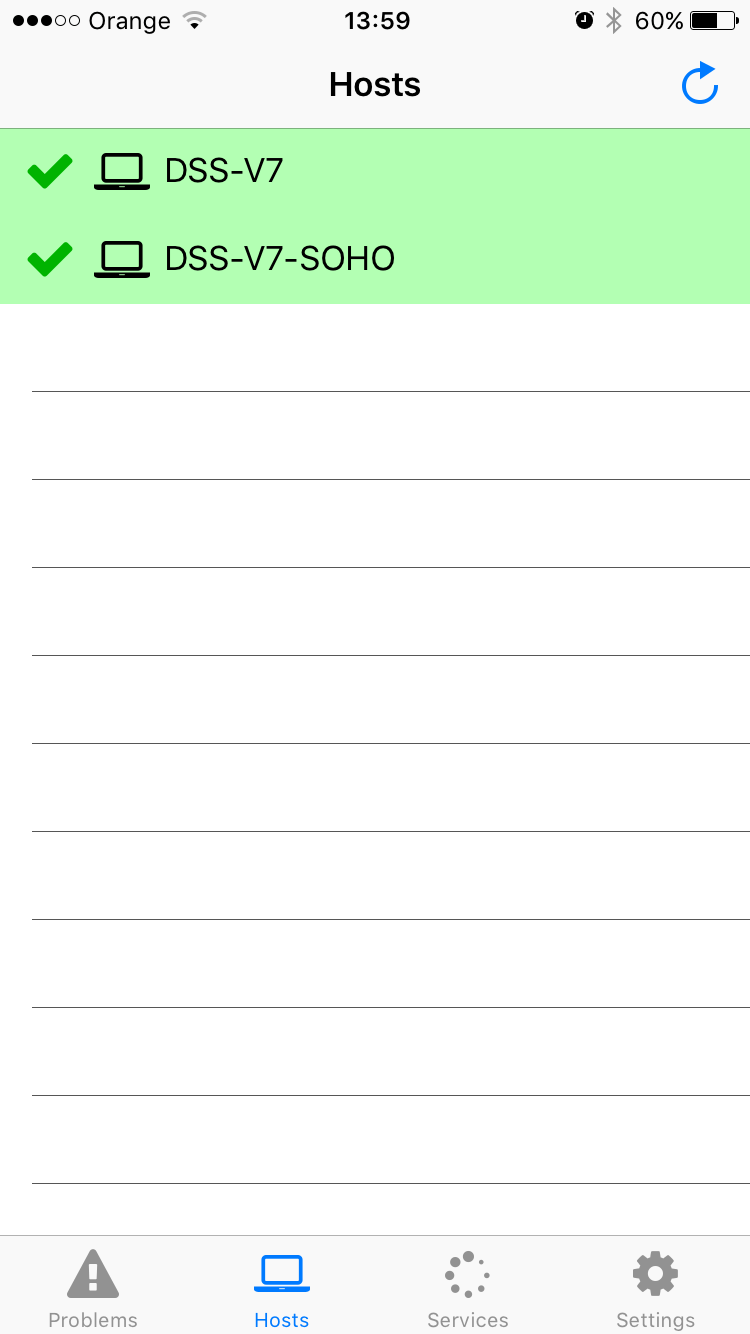
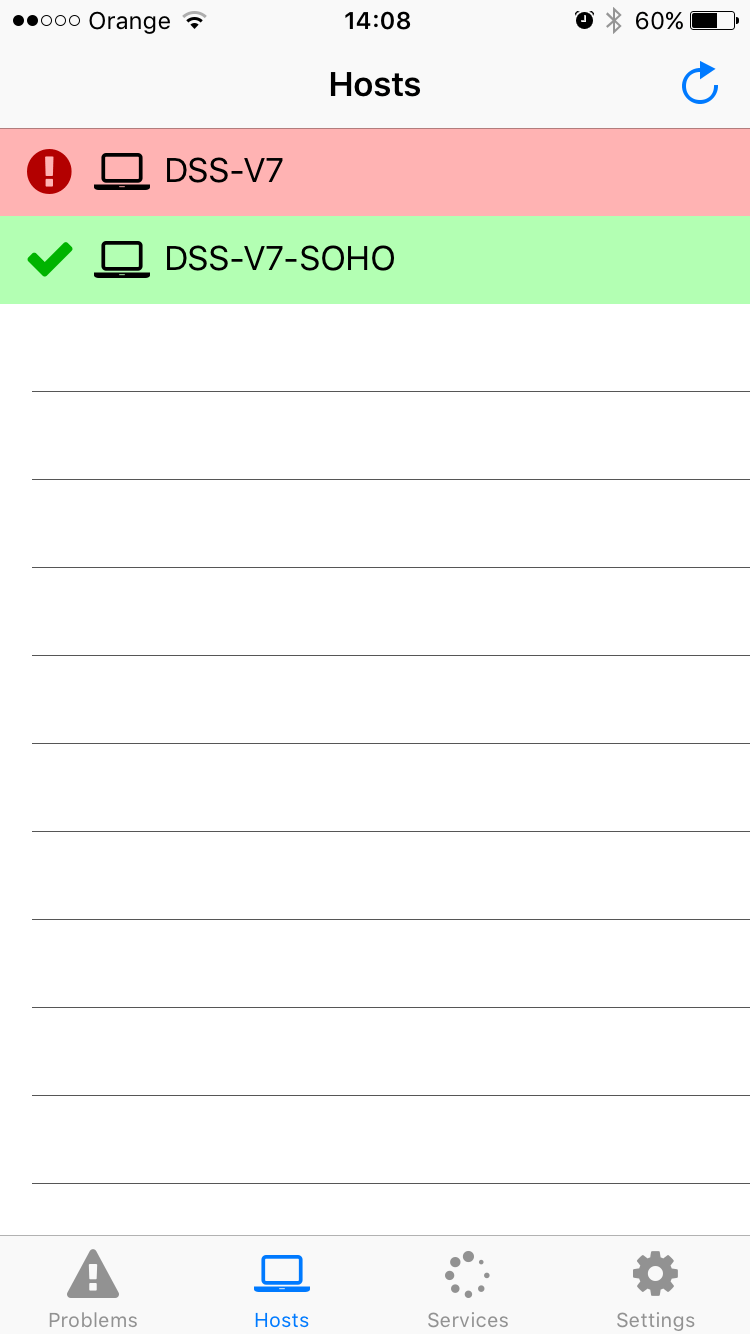
1. Go to the “Hosts” tab to see the list of servers monitored by your Nagios software.
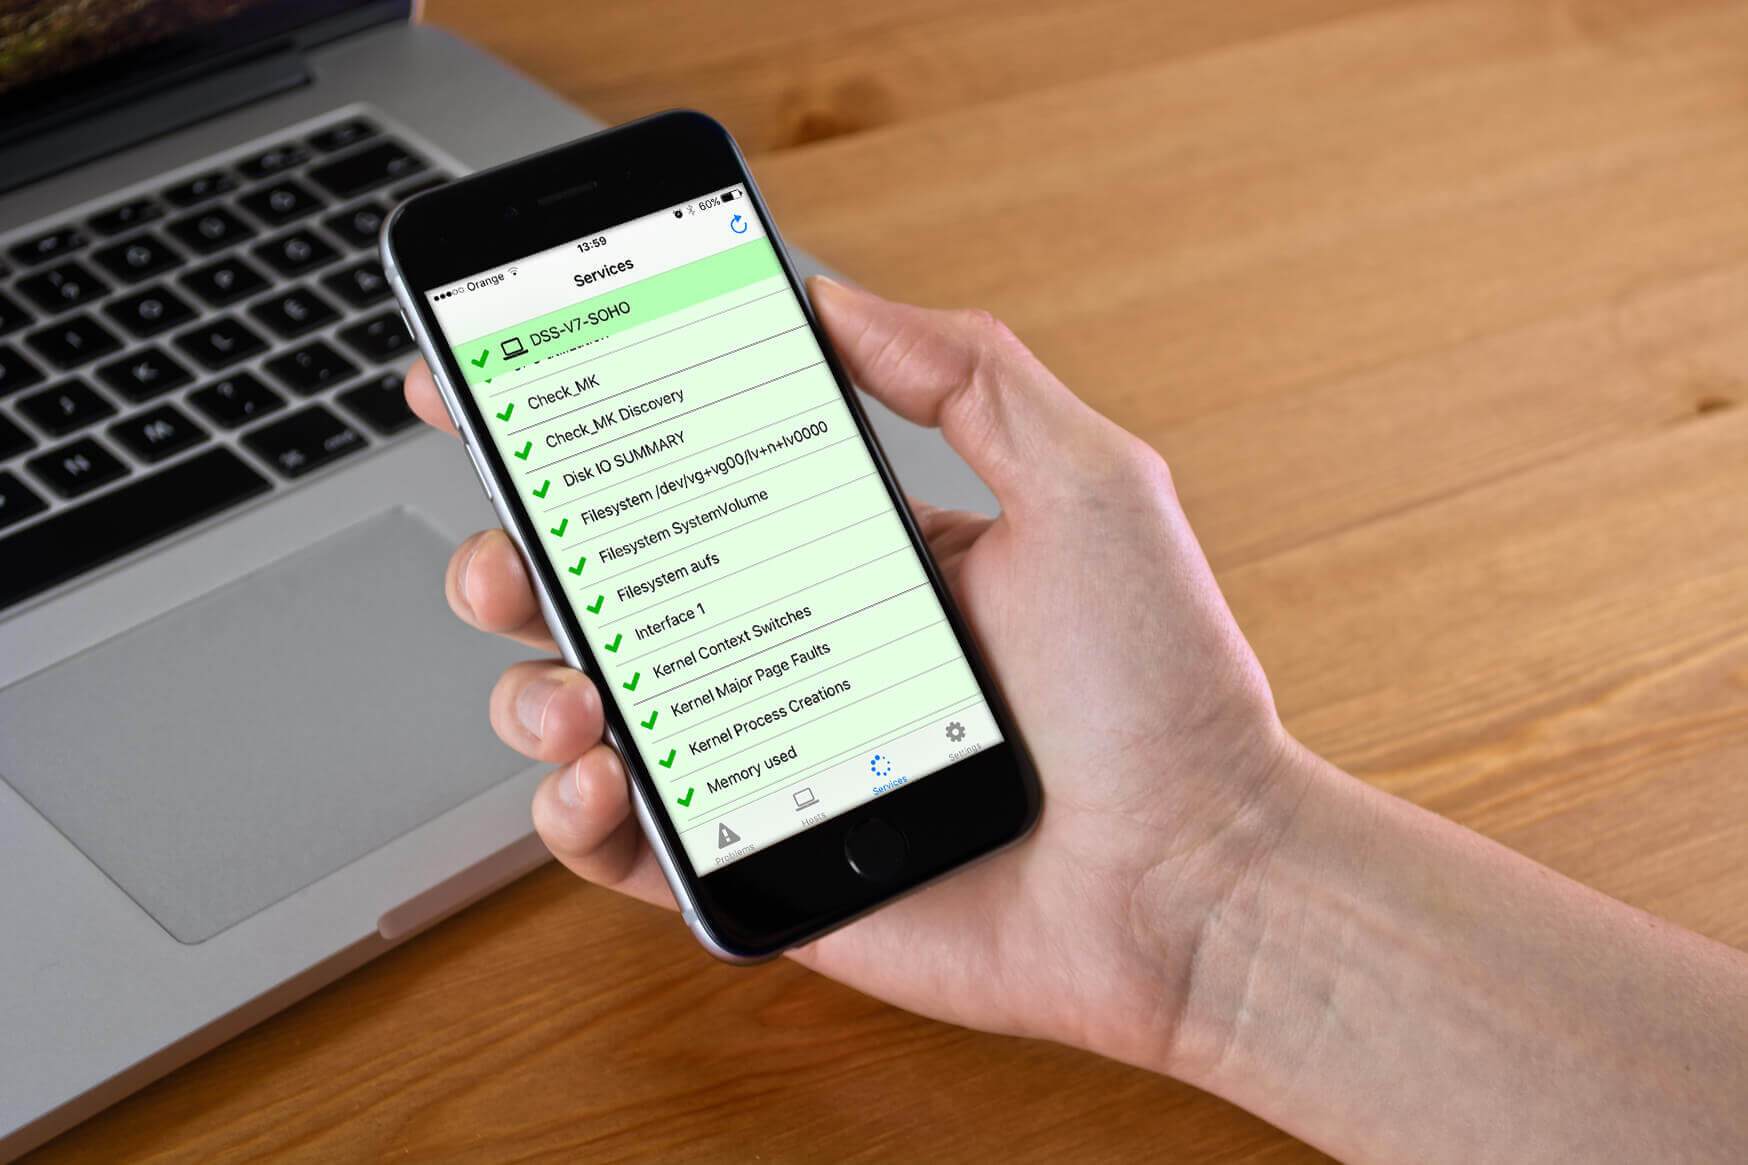
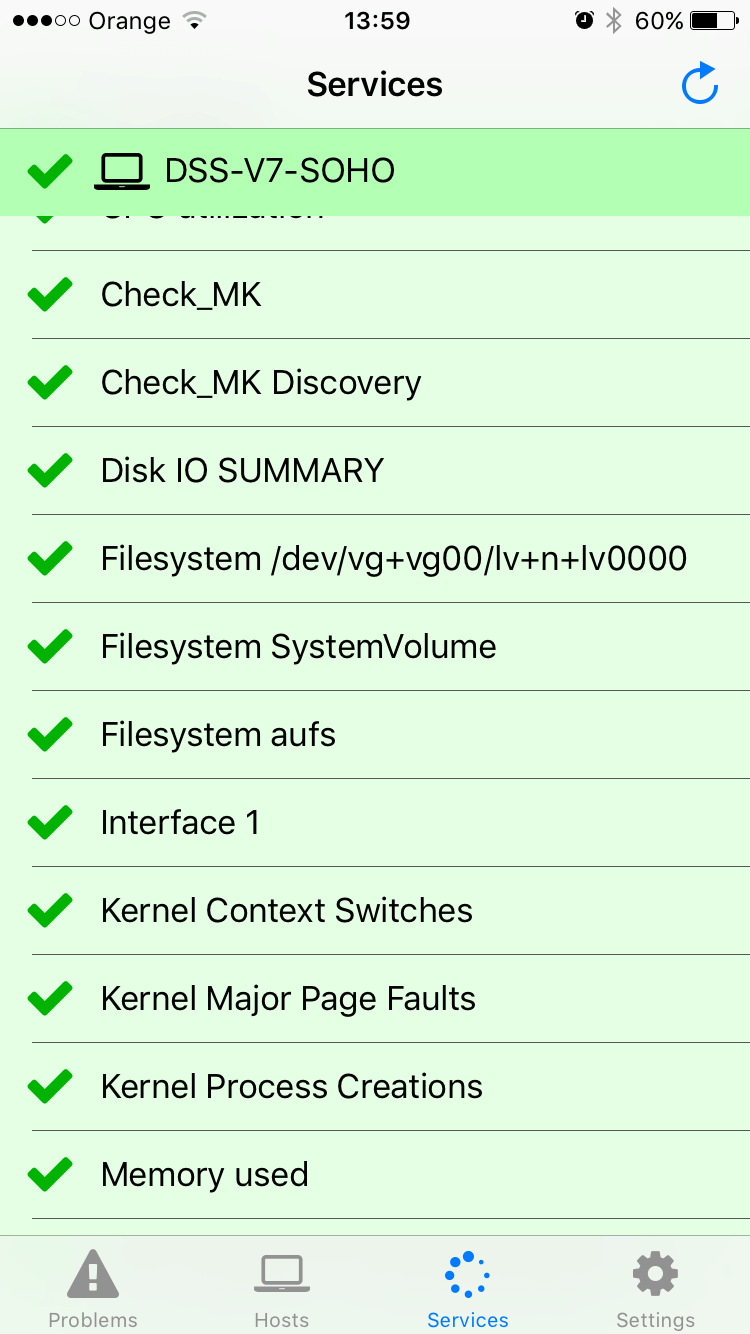
2. To see a detailed list of all system services on the servers that are monitored by your Nagios software, you can go to the “Services” tab. A service that works correctly is shown on a light green background.
3. If a server is not available or if there are other problems with it, you will see it highlighted in red color.
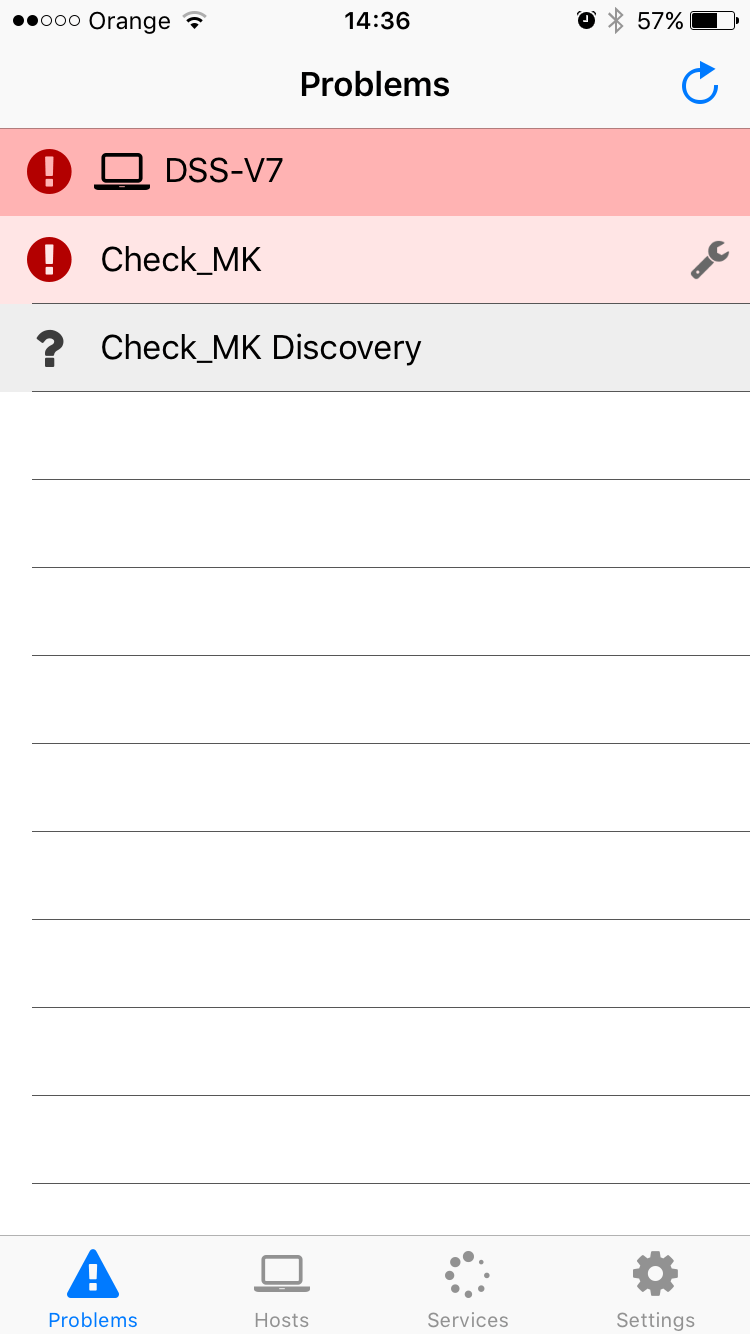
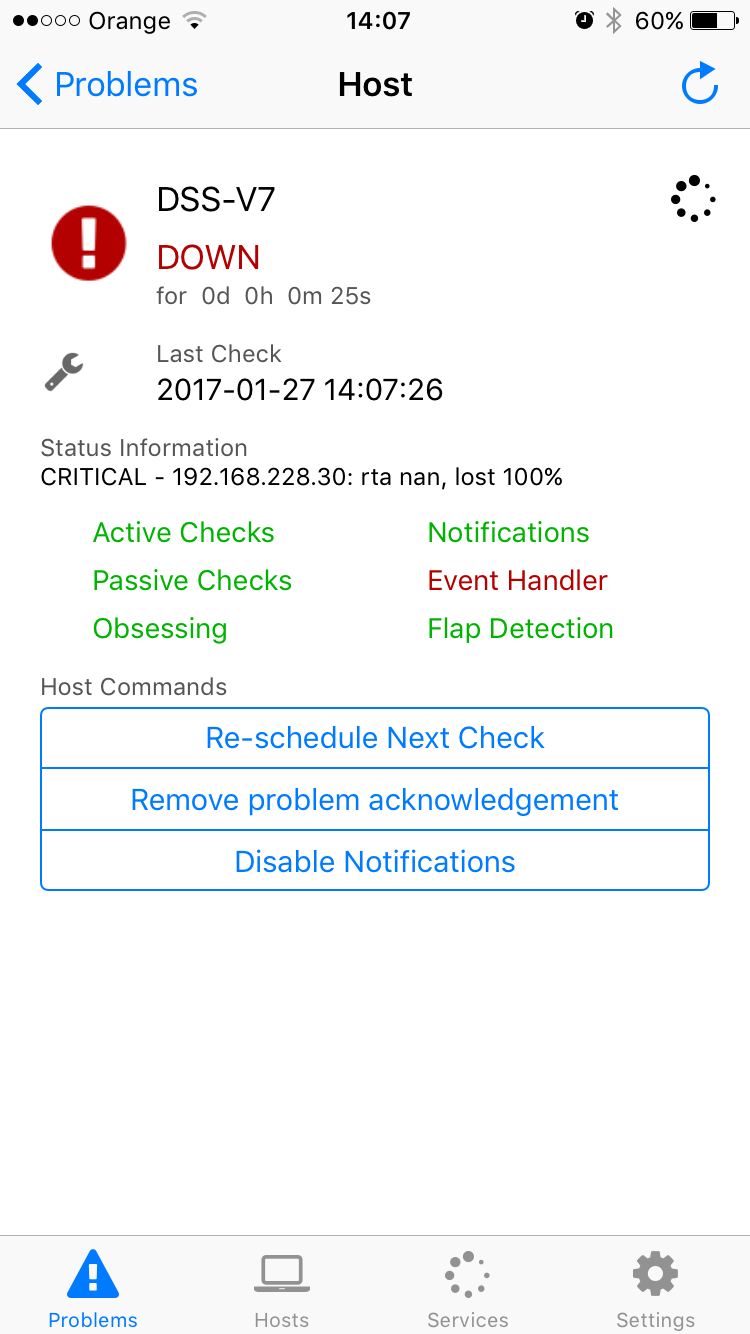
4. To see more details of the problem you can switch to the “Problems” tab which shows a detailed view of the issues. This view shows only those servers and/or services that aren’t working properly at the moment.
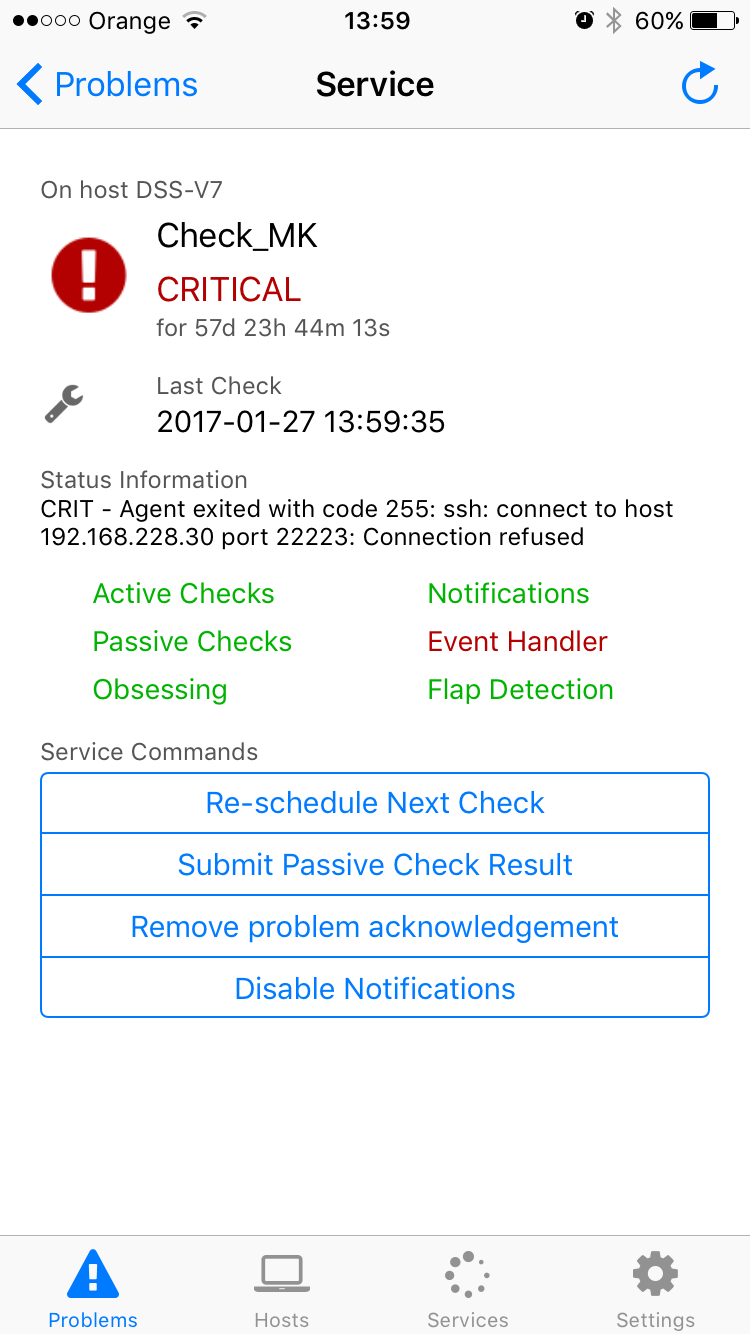
5. By tapping on a problem’s title you can go to the screen with more details.
System notifications
1. In order to display push notifications on your iOS device, MobiosPush requires an additional server-side configuration.
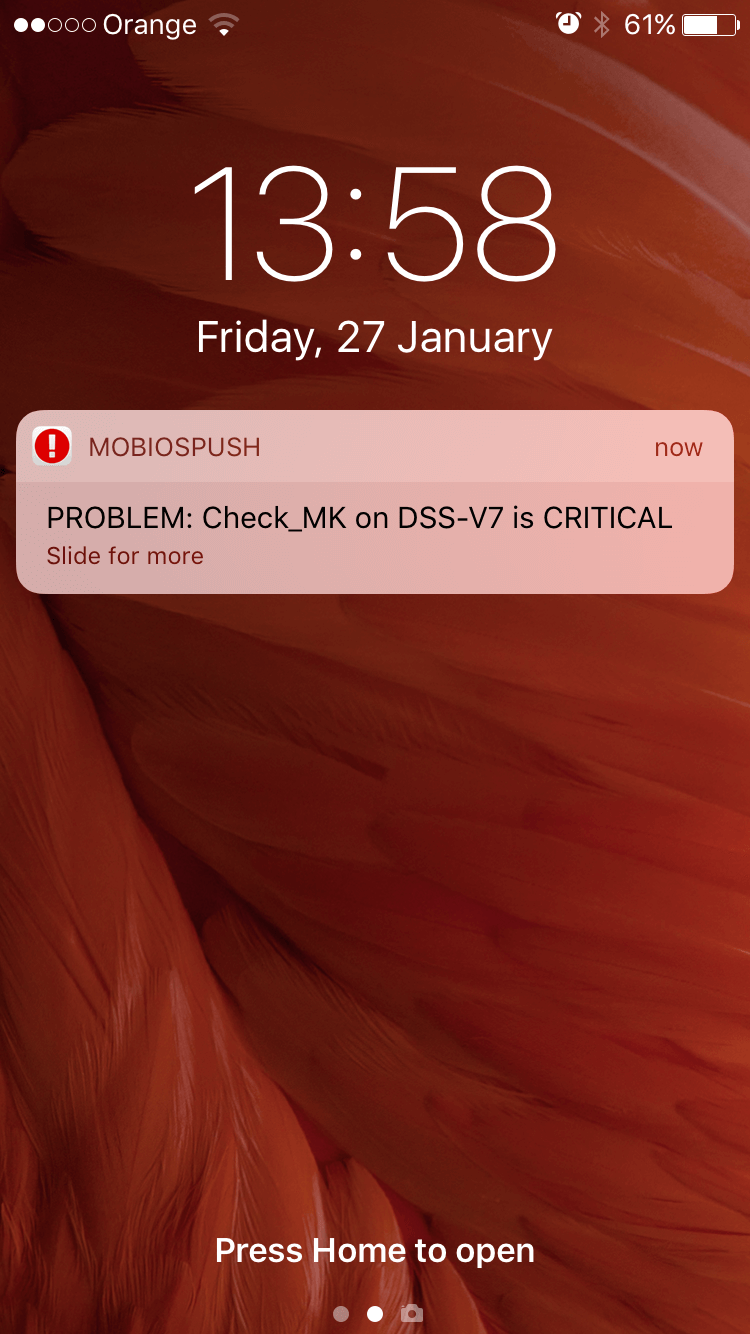
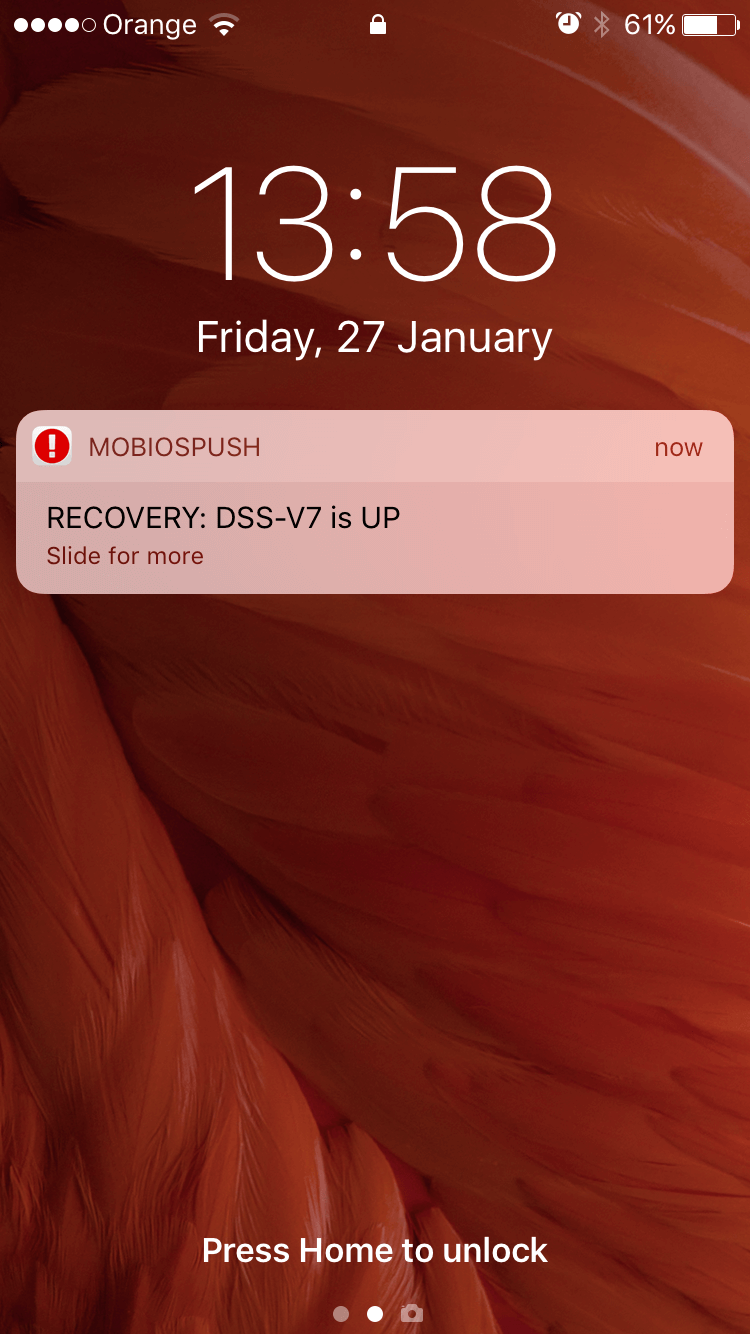
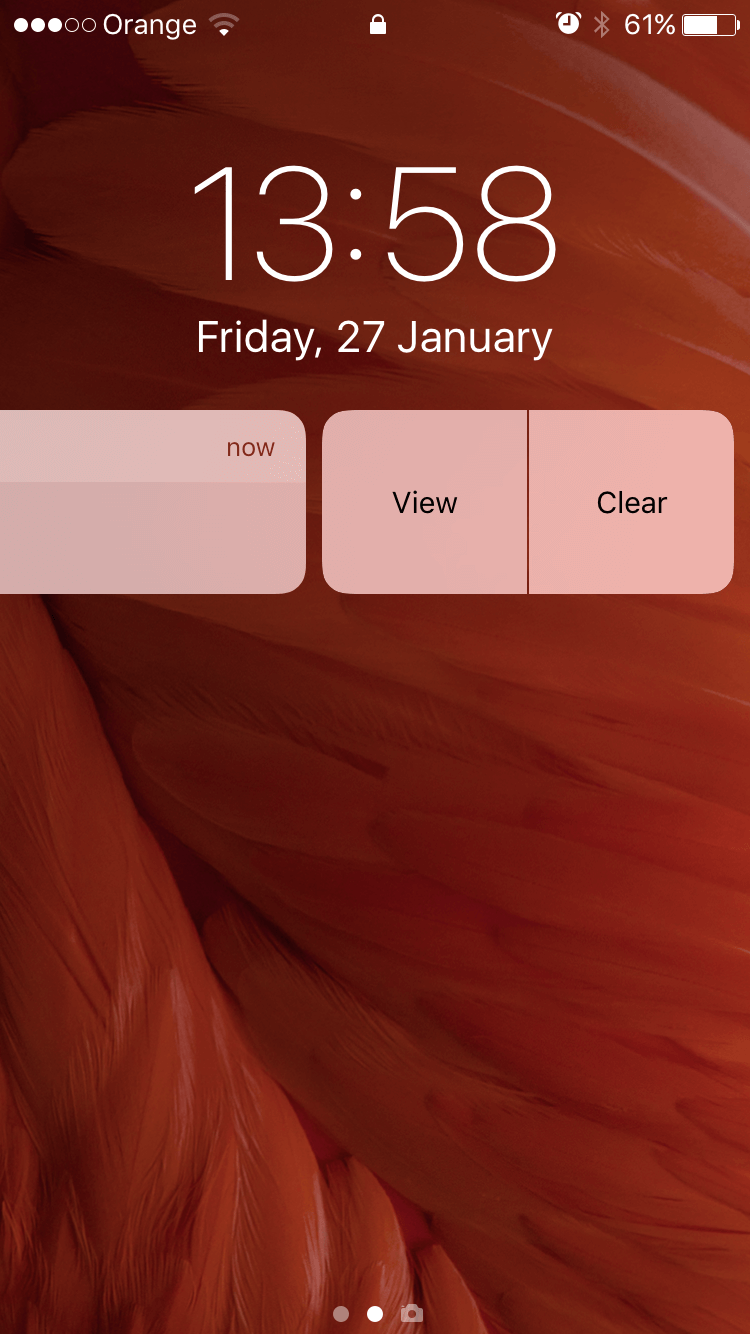
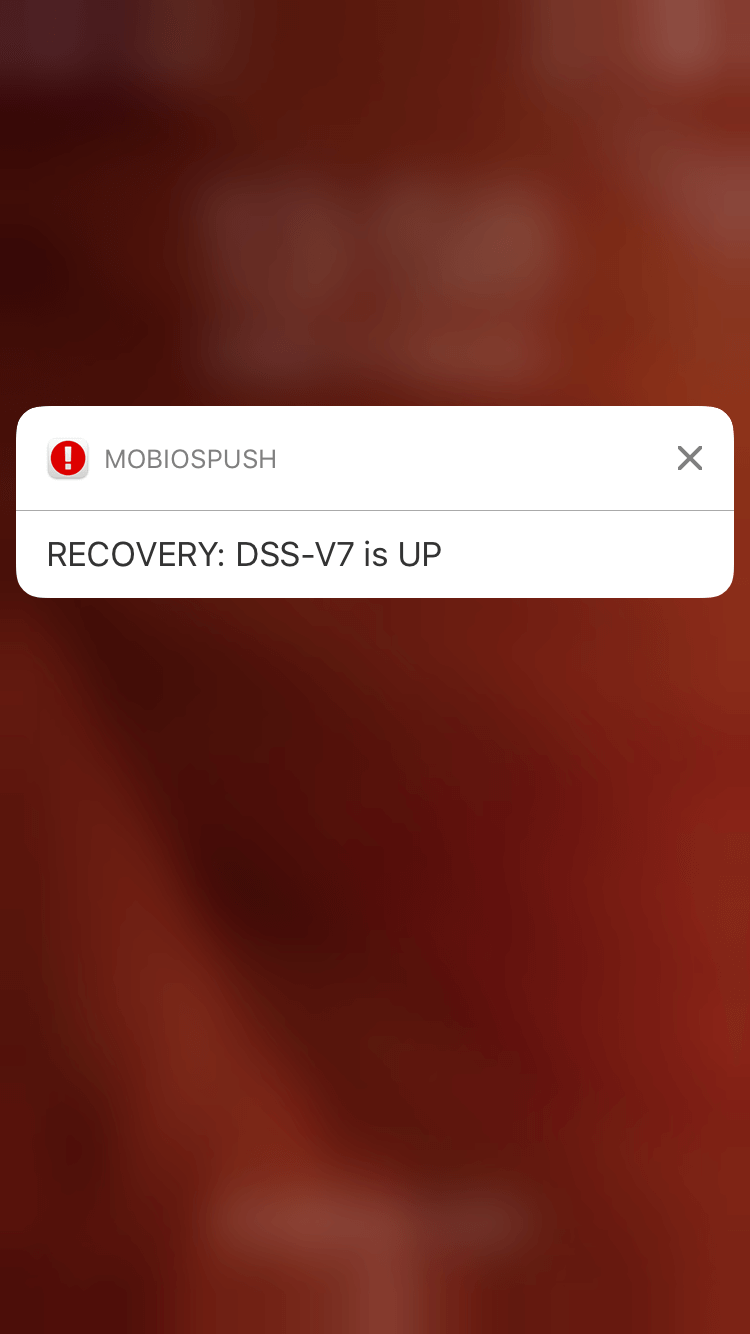
2. The application can display notifications when systems or a service are down as well as when they are restored and are working properly again. By default the sounds of “bad” and “good” notifications are different, of course both types are configurable in the application and can be replaced with custom sounds. Notifications generated by MobiosPush behave like any other iOS notifications.
Read also the article “Monitoring Open-E DSS V7 and Open-E JovianDSS with Check_MK” where you’ll find axplanation of how to monitor your Open-E software with Check_MK, an extension to Nagios which enables creating a rule-based configuration with Python.




Leave a Comment