


Among the characteristics of an optimal data storage solution, several features should stand out. It should provide full checksumming, self-repair, and backup and restore capabilities with short RPOs and RTOs. Additionally, it must allow for the implementation of comprehensive disaster recovery plans, ensuring high hardware redundancy and resilience to unexpected hardware failures. Adequate performance for both HDD- and SSD-NVMe-based systems is essential, along with scalability to accommodate growing data needs. Efficient data management should reduce the data footprint, complemented by unlimited data versioning for maximum flexibility. Furthermore, low total cost of ownership (TCO) can be achieved through lower hardware consumption, reduced data center space requirements, and ease of use that minimizes staff training costs.
Effective monitoring that enhances reliability is also one of the most important features that should be included on this list. Tools like Checkmk or others — natively implemented — are essential for maintaining system reliability and performance. They allow for quick failure analysis and detailed system monitoring, respectively, which help in proactive management and quick issue resolution.
Open-E JovainDSS, an enterprise data storage system, includes two main monitoring features – Checkmk and a natively implemented one. The first is implemented as a built-in system feature, and the other is a seamless integration with an external application. So, let’s dive deeper into these features, specify how they support your data storage infrastructure’s monitoring, and discuss the differences between them.
The Monitoring Tools
As we established, efficient data storage monitoring is essential for ensuring system health and performance in today’s enterprise data storage environments. At Open-E, we believe monitoring and diagnostics must be highly developed and easy to manage simultaneously. It allows the administrator to quickly recognize system errors, avoid their consequences, and prevent issues from repeating as much as possible. But how do native diagnostics and Checkmk tools implemented for Open-E JovianDSS work? How do they enhance diagnostics and performance management to create a more robust data storage infrastructure? How do the Open-E JovianDSS diagnostics tool and Checkmk swift ongoing monitoring capabilities to optimize your system’s reliability and efficiency? Let’s find out!
Open-E JovianDSS Diagnostics for Data Storage Monitoring
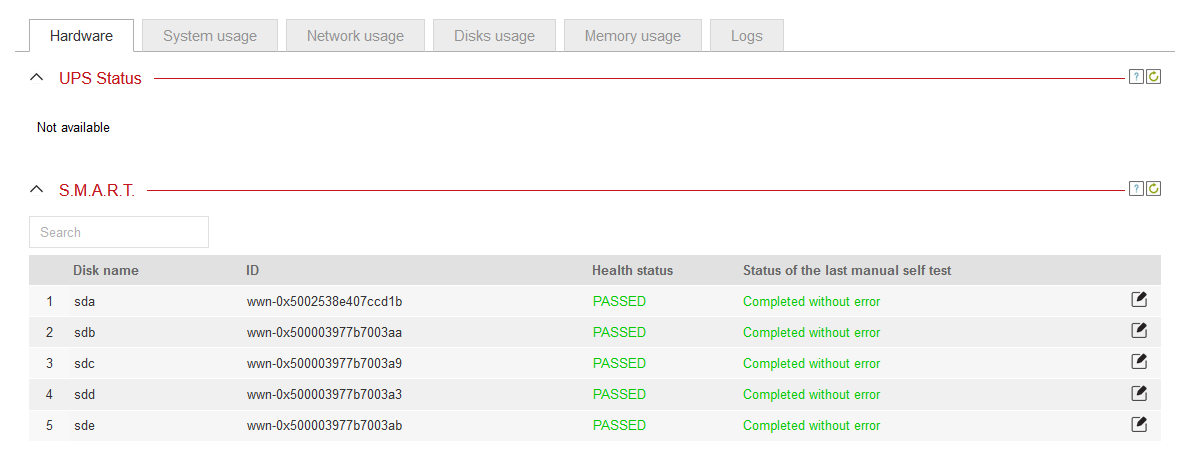
The Open-E JovianDSS Diagnostics tab is a part of the software designed for quick, ad-hoc checks of system usage and issues that have already occurred. Furthermore, Diagnostics ensures a comprehensive graphic depiction of system usage divided into 5 tabs (described below), as well as email notifications and an event viewer.
In Open-E JovianDSS, it’s available from the main GUI menu at the bottom of the function tabs. Two methods exist for extracting essential information about the infrastructure’s main statuses.
- The user can pull out only the abstract of all the reports mentioned above, which provides the most crucial information. You can find there information such as:
- Hardware – UPS Status and S.M.A.R.T. diagnostics
- System usage – e.g., CPU usage, System load, list of opened files and user processes
- Network usage – information about traffic on network cards
- Disks usage – read and write operations provided in MiBs/s (by default, but others are also available)
- Memory usage – information about read cache (ARC, L2ARC) and write log (ZIL)
- Users can also access the Log tab, where they can download the comprehensive set of logs about the overall system performance and health within multiple folders and files.
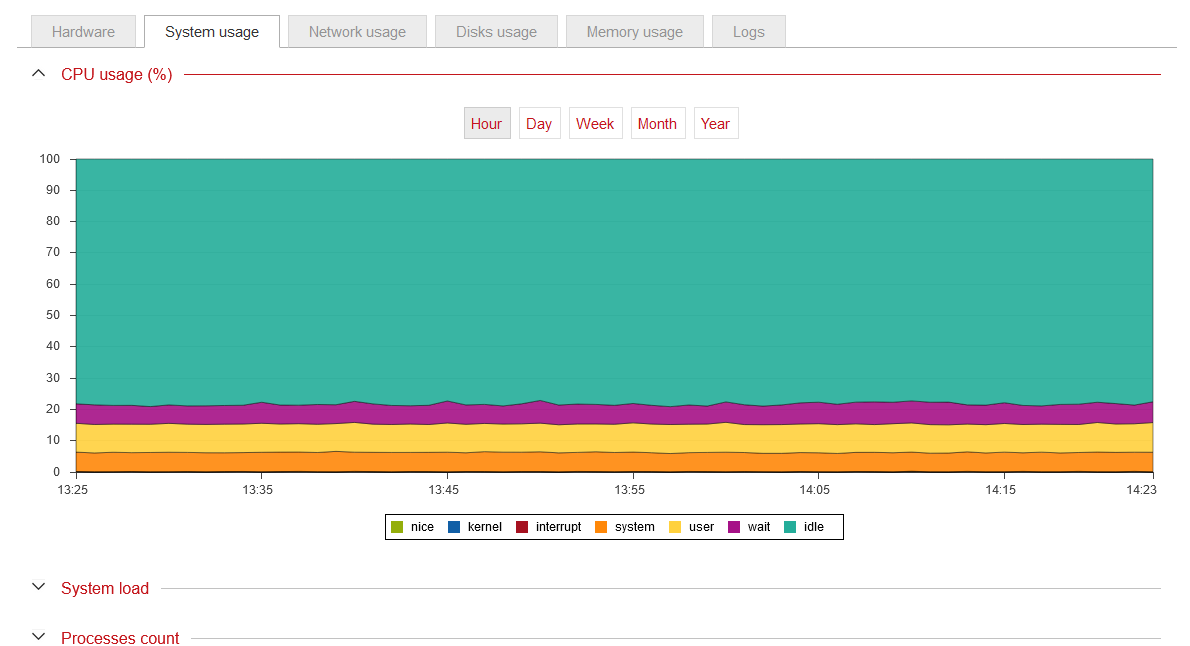
The Diagnostics tab allows viewing all the information in highly readable charts and diagrams. Thanks to this, the administrator can easily access clear and easy-to-analyze information, greatly facilitating performance management and correct operation of the data storage infrastructure. Memory usage, disk usage, network usage, running some tests on drives – no problem! All this is available at the touch of a finger with just a few clicks!
Checkmk Tool for Data Storage Monitoring
Checkmk is a tool designed for ongoing, comprehensive monitoring and historical analysis, helping maintain overall system health and performance over time. This tool continuously tracks system performance and health, providing detailed monitoring and alerting capabilities. Checkmk permanently monitors various system parameters, recording them in a database to provide both real-time and historical data on system performance. It offers detailed charts and status indicators that give a broader, more detailed view of system operations and trends, making it ideal for proactive data storage management. The system generates alerts based on the status of these parameters and sends notifications to administrators when thresholds are crossed. This ensures that potential issues are identified and addressed promptly before even they occur.
The tool runs an agent every minute, storing values and displaying changes over time, which is crucial for long-term monitoring and proactive maintenance. Checkmk monitors system parameters with state changes (GREEN, YELLOW, RED, GREY) and sends event messages via email for state changes, thereby reducing the number of messages and focusing on important information. It is configurable for various levels of alerts, such as OK, Warning, and Critical, and allows for trend analysis over user-defined periods. With the historical data collected, Checkmk can perform basic forecasting to predict future values of certain metrics. This helps in proactive capacity planning and effective resource management. This comprehensive monitoring approach ensures ongoing system health and performance optimization, making Checkmk an indispensable tool for enterprise environments.
Checkmk in Open-E JovianDSS
Open-E JovianDSS works with full compatibility in Checkmk and can be managed using two different methods:
- Using the “Small updates” section in the Open-E JovianDSS diagnostic module, a Checkmk container containing pre-defined rules is installed. It extracts the necessary information for the relevant system parts monitored by Checkmk, and the user is notified if something in the data storage infrastructure goes wrong.
- The last method works as a preconfigured virtual machine provided by Open-E, also containing the predefined rules for the agent to connect to. It connects to Open-E JovianDSS and monitors the system using predefined rules. The benefit of such a solution is that it does not overload the system by sending multiple requests per second, as in the second method.
The Differences
The first difference that comes to mind is, as mentioned at the beginning of this article, how they work with Open-E JovianDSS. The Diagnostics tab is a module built into the system as a native, integral feature, while Checkmk is a seamlessly integrated external application.
However, we can also differentiate these methods according to their purpose of usage. The Diagnostics internal mechanisms work per user request and provide information only when needed. These are various reports in the form of charts and plain text. In Open-E JovianDSS, data storage administrators are given the possibility of quickly reacting to any abnormalities in data storage infrastructure maintenance and operations.
Checkmk, on the other hand, constantly monitors system performance, physical and virtual servers, database performance, network interfaces and traffic, cloud services and containers, hardware and software assets across the monitored environment and is fully automated once configured. This automation makes monitoring much easier because Checkmk notifies the administrator of any unexpected errors. As a result, there is no need to generate reports periodically, as Checkmk constantly watches over the efficient and smooth operation of data storage infrastructure. As a result, it squeezes the most out of the system’s monitoring capabilities and helps proactively control operability and performance.
Learn More about Diagnostics in Open-E JovianDSS
If you’d like to know more about checking the data storage diagnostics in Open-E JovianDSS watch the video below:
For more Open-E JovianDSS tutorials visit our YouTube channel


Leave a Comment